EV vs Petrol: The Real Cost War
For decades the question was simple: “Will electric cars ever be affordable?” That question has now flipped on its head. Today the more pointed version is: “Why would anyone still buy a petrol car when an EV is cheaper to own?”
This is a genuine shift in automotive economics. In this comparison we break down the real numbers, not marketing claims but the actual costs you will live with as an owner, across purchase price, fuel, maintenance, insurance, tax, and depreciation.
The headline conclusion is striking: over a typical five-year ownership period, an electric car generally costs meaningfully less to run than an equivalent petrol model, with lower fuel and maintenance bills more than offsetting a higher sticker price. To see exactly where the money goes, we need to examine each cost category in turn. First, the short video below summarises the picture.
With that overview in mind, let’s start with the one area where petrol still holds a narrowing lead: the upfront purchase price.
Purchase Price: Still Higher, But Closing Fast
EVs do still cost more to buy, but the gap is shrinking quickly. Across most segments the premium has narrowed to a few thousand pounds before any incentives, and once government grants are applied many EVs now land at parity with, or even below, their petrol equivalents. The table below shows the rough picture across typical vehicle classes.
| Vehicle Type | Petrol Car | Equivalent EV | After Incentives |
|---|---|---|---|
| Compact hatchback | £18,000 | £22,000 | ~£20,000 (roughly tied) |
| Family sedan | £28,000 | £32,000 | ~£30,000 (EV cheaper) |
| SUV | £35,000 | £40,000 | ~£38,000 (EV slightly more) |
| Premium sedan | £50,000 | £52,000 | ~£50,000 (roughly tied) |
The key takeaway is that the purchase-price disadvantage, once the EV’s biggest weakness, has become modest and is often erased entirely by incentives. And as we will see, it is comfortably recovered through running-cost savings within a few years.
Low-Cost Accessories to Protect Your Savings
If lower running costs are the goal, it pays to protect the car itself so it holds value and stays cheap to keep. These two inexpensive, universal accessories suit any new EV or petrol car alike.
Since EVs retain value better when the interior stays pristine, a set of all-weather rubber mats and a boot liner is a cheap insurance policy. They trap mud, water, and spills, protecting carpets and helping safeguard the strong resale value that makes EVs so cost-effective.
Cheap home charging is where EVs win the cost war, so it makes sense to look after the port. A simple dust and moisture cover keeps grit and water out of the charging socket, protecting an expensive component and helping every charge stay clean and trouble-free.
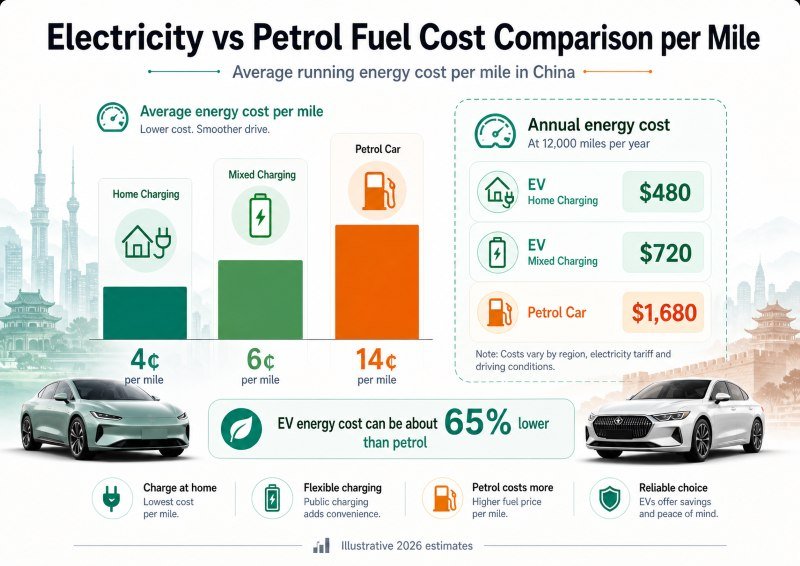
Fuel and Energy: The EV’s Biggest Win
This is where EV economics become genuinely compelling. The cost of “filling up” is where the two technologies diverge most sharply, and the gap is large in the EV’s favour across every realistic driving scenario.
| Driving Scenario (12,000 mi/yr) | Petrol Cost | EV Cost | Annual Saving |
|---|---|---|---|
| Home charging (£0.25/kWh) | £1,400–£1,800 | £250–£350 | £1,050–£1,550 |
| Public fast-charge mix | £1,400–£1,800 | £400–£550 | £850–£1,400 |
| High mileage (20,000 mi/yr) | £2,300–£3,000 | £500–£750 | £1,550–£2,500 |
The reason the gap is so wide comes down to physics and policy together. Electricity costs several times less than petrol per unit of useful energy, EVs convert around 85–90% of that energy into motion against roughly 20–30% for a combustion engine, and fuel duty does not apply to electricity in most places. Add cheap off-peak home charging and the advantage compounds, especially for high-mileage drivers who stand to save the most. Crucially, this is also the most predictable saving of all: it recurs every single month, in all weathers and driving styles, which is what makes it the foundation of the EV’s whole cost case.
💡 Pro Tip: The single biggest lever on EV running cost is an off-peak home tariff. Charging overnight on a cheap rate can cut energy cost to a fraction of daytime public charging, which is what turns the headline fuel savings from good into transformative.
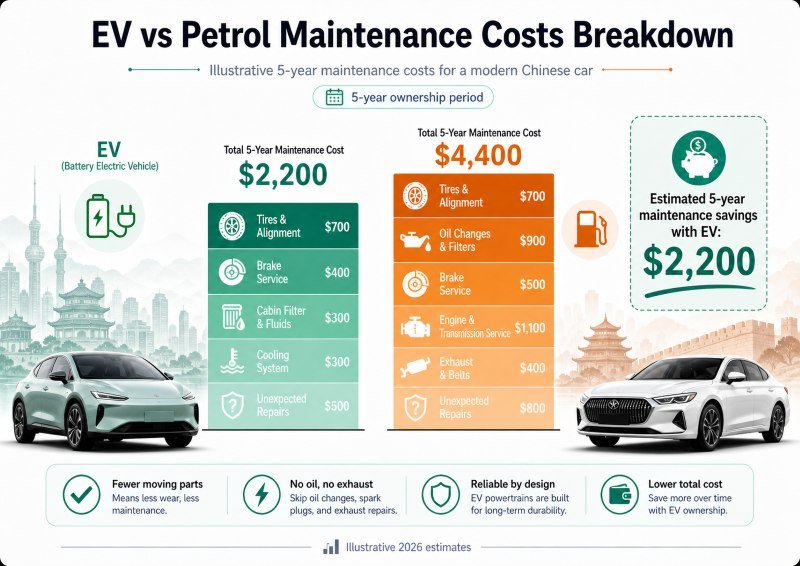
Maintenance: Far Cheaper Over Time
This is the hidden advantage most petrol owners overlook. With around 70% fewer moving parts, an EV simply has far less to service: no oil changes, no spark plugs, no transmission fluid, no engine filters, and reduced brake wear thanks to regenerative braking. The table below shows how the five-year servicing bill compares.
| Maintenance Item (5 years) | Petrol Car | EV |
|---|---|---|
| Oil changes | £400–£500 | £0 |
| Air filters | £150–£200 | £0 |
| Spark plugs | £200–£300 | £0 |
| Transmission service | £200–£400 | £0 |
| Brakes (regen reduces wear) | £500–£700 | £150–£250 |
| Tyres (similar) | £600–£800 | £600–£800 |
| Total 5-year maintenance | £2,500–£3,500 | £820–£1,180 |
Fewer systems mean fewer failures, which mean lower bills and less downtime. Over five years that translates into well over a thousand pounds of savings, and the advantage only widens as the car ages and a petrol engine’s wear items begin to demand attention.
Insurance, Tax and Depreciation
The remaining categories are more nuanced but still tilt the overall picture toward electric. Insurance ran slightly higher for EVs while insurers built up data, reflecting pricier batteries and specialist repair, but premiums are steadily converging toward parity as risk profiles become better understood. Road tax currently favours EVs strongly in many markets through exemptions, saving a few hundred pounds over five years, though rules are tightening over time and should be checked locally.
Depreciation has swung in the EV’s favour too. Early electric cars lost value quickly amid battery anxiety and rapid technology change, but proven battery durability, growing demand, and limited used supply now help many EVs retain more of their value over five years than comparable petrol cars. Since depreciation is usually the single largest cost of ownership, that swing matters a great deal to the final total.
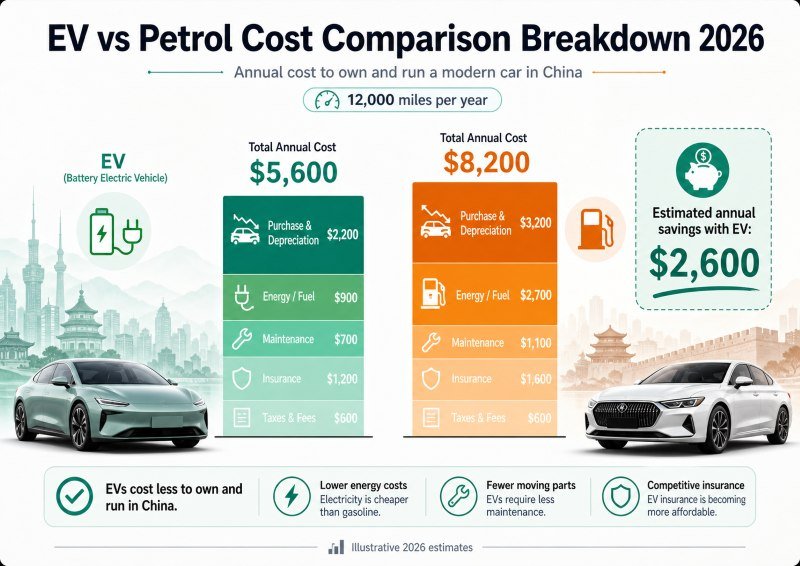
Total Cost of Ownership: The Verdict
Pulling every category together for a typical mid-size sedan over five years and 60,000 miles shows how decisively the numbers stack up once everything is counted.
| Cost Category (5 yr) | Petrol Sedan | Equivalent EV |
|---|---|---|
| Purchase (post-incentive) | £28,000 | £28,000 |
| Fuel / energy | £7,000–£9,000 | £1,500–£2,500 |
| Maintenance | £2,500–£3,500 | £820–£1,180 |
| Insurance | £6,500–£7,500 | £7,000–£8,000 |
| Road tax | £500–£600 | £0 |
| Depreciation (residual) | ~40% retained | ~48% retained |
| Net 5-year advantage | EV saves roughly £6,000–£15,000+ | |
The bottom line is clear: over five years an EV typically costs around 30–45% less to own and run than an equivalent petrol car, even after the higher purchase price. The break-even point usually arrives within roughly three years, after which the savings simply accumulate, and they grow larger still for high-mileage drivers and over longer ownership periods.
⚠️ Important Note: These figures are illustrative averages based on typical mileage, electricity, and fuel prices, and they vary by country and circumstance. Drivers without home charging, or those covering very low annual mileage, will see a smaller EV advantage. Always run the numbers for your own situation before deciding.
Where Petrol Can Still Make Sense
For all the EV’s advantages, petrol is not universally beaten. It can still be the rational choice for drivers with no realistic charging access at home or work, for those with extreme towing needs, and in regions with very high electricity prices or no incentives. Cold climates that sap range and markets with limited EV choice can also tip the balance. These are real cases, but they are increasingly the exception rather than the rule, and they tend to come down to circumstance rather than pure cost.
FAQ: EV vs Petrol Costs
Is an electric car really cheaper than a petrol car overall?
For most drivers, yes. Over a five-year period an EV typically costs around 30–45% less to own and run once fuel, maintenance, tax, and depreciation are included, even after accounting for a higher purchase price. The main exception is drivers with no home charging and very low mileage.
How much can you save on fuel with an EV?
Charging at home, an EV often costs roughly a quarter of what a petrol car spends on fuel for the same mileage. A typical driver covering 12,000 miles a year can save around £1,000–£1,500 annually, and high-mileage drivers can save considerably more.
What about EV battery replacement costs?
Battery replacement is rare within normal ownership. Most EV batteries carry 8 to 10-year warranties and seldom fail before very high mileage. If a pack ever does need replacing, the cost is significant but still comparable to major engine or transmission repairs on a petrol car over the same lifespan.
Does an EV hold its value better than a petrol car?
Increasingly, yes. Early EVs depreciated steeply, but strong demand, limited used supply, and proven battery durability now help many EVs retain more of their value over five years than equivalent petrol cars, improving their total cost of ownership further.
Why Petrol Is Becoming Economically Hard to Justify
When the maths is this lopsided, sticking with petrol on cost grounds becomes increasingly difficult to defend. Fuel prices are structurally prone to rise and are taxed heavily, while electricity, even if it climbs, starts from a far lower base. Petrol cars demand more frequent and more expensive servicing, depreciate faster as buyer demand shifts toward electric, and attract a growing array of charges, from fuel duty to congestion and emissions levies, that EVs largely avoid. Layer on the looming sales bans planned in many major markets over the coming years, and the long-term residual value of a new petrol car looks shakier still.
None of this means petrol drivers are making a foolish choice today; many have perfectly good reasons. But purely on the numbers, the case for a new combustion car is narrowing year by year, and for the average buyer it increasingly rests on preference or specific need rather than cost.
Regional Variation Matters
It is worth stressing that the size of the EV cost advantage depends heavily on where you live. The economics are strongest in markets that combine cheap or off-peak electricity with meaningful incentives and zero or low road tax, where the running-cost gap is at its widest and the payback period at its shortest. Several European markets and parts of North America fall into this category, with dense charging networks reinforcing the benefit.
The picture is more marginal where electricity is expensive, incentives are thin, or charging infrastructure is sparse, and cold climates that reduce winter range can erode the advantage further. The principle holds almost everywhere that an EV is cheaper to run, but the scale of the saving, and how quickly it offsets the purchase premium, varies enough that running your own local numbers is essential before committing.
The Bottom Line: The Cost War Has a Clear Winner
When purchase price, fuel, maintenance, insurance, tax, and depreciation are all weighed together, the financial case for electric is now compelling rather than marginal. An EV typically costs 30–45% less to own and operate over five years than an equivalent petrol car, and the gap widens with mileage and time. For a buyer making a purely rational decision, the maths increasingly points one way.
That does not make petrol obsolete overnight; necessity, preference, and specific circumstances will keep combustion cars on the road for years yet. But for the typical driver with access to home charging and normal mileage, the cost war has effectively been settled, and electric is the side that won it.